The histogram should always be something to bear in mind – no matter if you’ve just started or you’re already an experienced landscape photographer.
Yes, I’m talking about that weird little mountain-like chart you have certainly noticed on your camera display. But what exactly is a histogram?
I will try not to get too scientific in my explanation. Also, there is no such thing as “perfect histogram” or “ideal exposure”. These things will always depend on what you want to achieve so consider this blog post as a well-meant piece of advice:
“Reading the histogram correctly will help you expose correctly on location and avoid potential issues in the editing process.”
Table of Contents
Disclosure
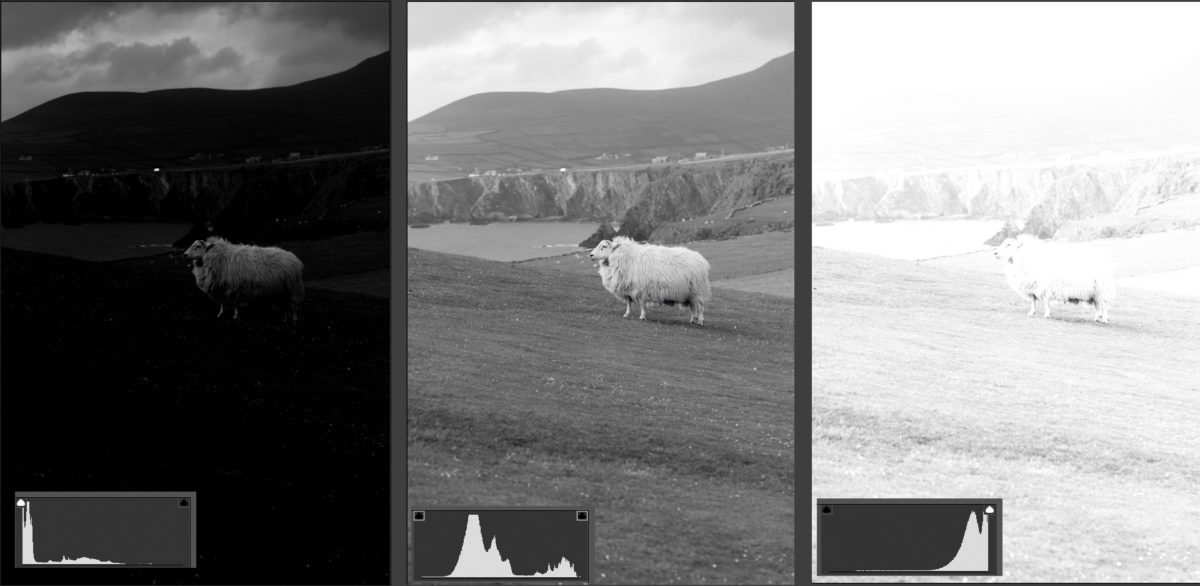
1. The necessary nerdy background of histograms
OK, we won’t do much math here but this simplified example below will help you understand the actual histograms.
Now, imagine you have 160 students in a year writing a review exam. In this particular exam, they can reach 0 – 10 points. Putting the results into a chart, you’ll get something like this:
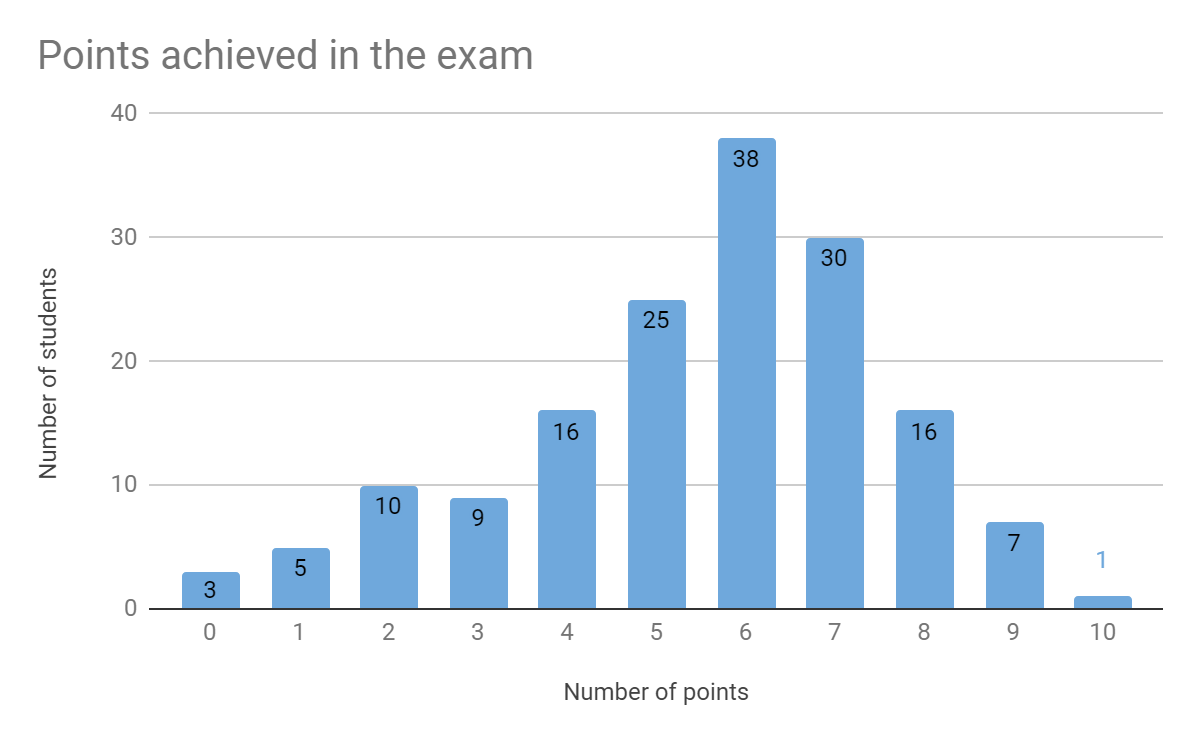
You would read this chart as: 3 students achieved 0 points in the test, 5 students got 1 point, 10 students got 2 points and so on, you get the picture.
And then there is Miss Granger, who’s the only student achieving the full score of 10 points. Obviously.

Now, it might sound like a far-fetched example but the actual image histogram does the very same thing. It only uses the number of pixels instead of students, and brightness levels instead of the exam score:

The most important thing to remember here is that the left part of the histogram represents dark tones and the more to the right you get, the brighter tones are represented.
Also, keep in mind the extremes – the very left point of a histogram shows you how many pixels are completely black, the very right point shows how many pixels are completely white.
When these situations occur, it’s called shadow clipping and highlight clipping. We’ll deal with these in a second.
2. Why should you use the histogram?
The main reason speaking for the use of histograms is simply because it is a much more precise representation of tone distribution than a glance on the LCD screen.
The screen preview might be misleading, especially in low light conditions as the display generates its own light and might make you think that your exposure is spot-on.
Or vice versa – when the light is very bright (e.g. sunset) and you squint the hell out of your eyes and still can’t see much on the screen. That’s the time for a histogram.
Last but not least and my personal favourite – using a histogram to avoid shadow clipping and highlight clipping. As I like to say:
“What is completely black, stays completely black. What’s completely white, stays completely white.”
What your camera is totally trying to tell ya
In other words, if you fail to spot clipping highlights in your photo on location, there is no way of recovering the detail in those areas in post-process! They are gone forever. They ceased to be. These highlights are ex-highlights. Even if you shoot in RAW!
This gets especially important when shooting panoramas. Having the small histogram chart in the corner of your display while test-swiping through your scene will help you to assess the required setting (aperture, shutter speed, iso).
3. How to display the histogram on your camera
The way of displaying the histogram on your screen will depend on the camera manufacturer and type.
Some cameras have this setting conveniently behind a “DISP” button or an “INFO” button. If you click them while in Live View mode, you should see the histogram.
If you can’t find it, google it. Or consult the user manual.
4. How does a typical histogram look like
OK, let’s have a look at a couple of histograms. In fact, these 6 types cover pretty much all the situations you’ll encounter on your photography journey.
I drew a simple overview below, notice that each histogram on the left side is the opposite of the histogram on the right side.
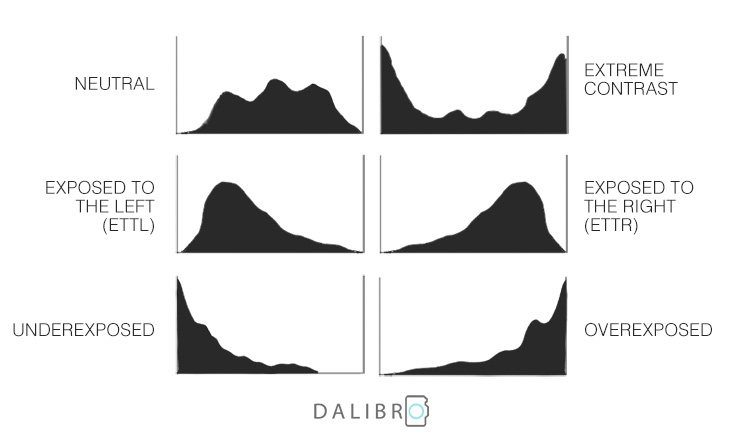
By no means are any of these histograms right or wrong! There is definitely space for intentionally under- or overexposed images in photography. So who am I to judge? Let’s go through the histogram types:
A. NEUTRAL HISTOGRAM
Usually, a good exposure, with no clipping. Straight out of the camera, it can look a bit flat (a.k.a. boring). Especially if most of the pixels are concentrated in the middle (mid-tones).
However, thanks to the nice even distribution of tones, a photo with this histogram will give you tons of freedom in the editing process!
B. EXTREME CONTRAST
Super-contrasty scenes. Like shooting against the sun contrasty, where your foreground is emo dark, while the sky is blown.
Difficult to handle but not impossible. Keep reading to find out how to tackle these extreme light conditions!
C. EXPOSED TO THE LEFT (ETTL)
In case you’ve ever seen the abbreviation ETTL – this is what it means. Basically, it occurs when the pixel mountain leans towards the left (dark) side of the histogram.
As there is no shadow clipping, you can still do a lot in the processing. Especially if you shoot in RAW.
However, if you push the exposure correction too far in Lightroom, you’ll soon notice that “brightening up” the dark tones leads to an increase of noise!
D. EXPOSED TO THE RIGHT (ETTR)
Many professional photographers prefer to expose to the right (ETTR) and I can see why. When you do expose to the right, you’ll keep loads of details even in darker areas. If you then want to darken the image, you can easily do it in the post-process without compromising the quality. Darkening bright pixels does not increase noise (unlike vice versa – see ETTL).
Another good reason is: bright pixels are sharp pixels, as I like to say! It is much more challenging to nail the focus in dark scenes.
Again, notice there is no highlight clipping.
E. UNDEREXPOSED
There is not much chance you can recover a lot of detail from underexposed images like this. Shadow clipping occurs big time here. Unless this is your goal, you should probably adjust your settings.
F. OVEREXPOSED
Similar to an underexposed histogram, just vice versa – with such histogram, you’ll lose details in bright areas as they are completely white and can’t be recovered. Unless it’s what you want, adjust your shutter speed, aperture or ISO!
5. Histogram and editing
In my extremely nerdy article about shooting in RAW format, I touched the elephant in the room only very gently – even editing RAW photos has limitations.
And that’s where histograms come really handy on location and save you from some serious trouble in editing.
Yes. I’m talking about the goddamn highlight clipping again. I know. But I can’t emphasize the importance of it enough.
I generally tend to either a neutral histogram or ETTR as it gives me the most freedom in editing. Darkening is always easier to do without a loss of quality than the way around.
But whatever your preference is, you should always adapt to the scene!
Last but not least – if you totally nailed your histogram on location, don’t forget to keep an eye on it while editing, otherwise it was all for nothing. And we don’t want that.

6. Handling extreme light situations
Typical extreme light situations are:
- looking outside through a window / door / tent opening etc. (outside very bright vs. inside very dark)
- sunrise / sunset
- shooting against the light in general
If you’re interested in more examples of these extreme light conditions with challenging dynamic range, make sure to check out some of my photography travels (photographing Slot Canyons in the US or shooting sunrise at the magnificent Saar Loop are some fine examples).
Here is a test image where I tried to asses the dynamic range in the scene. Can you spot what’s wrong?
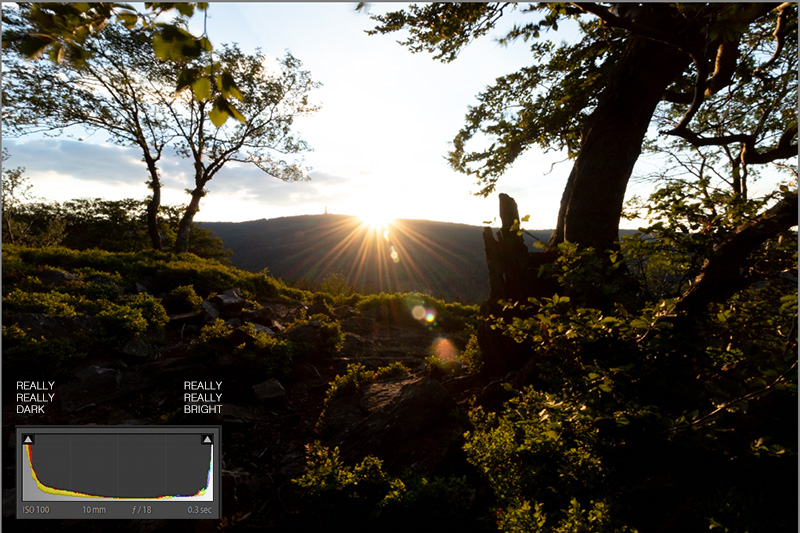
The histogram shows that most of the pixels in this image are either very dark (lots of them irreversibly black) or very bright (lots of them irreversibly white).
I played around with the shutter speed a bit to see if I could avoid the clipping at least on the right side and recover the rest in Lightroom. But it was simply not possible.
A typical case for exposure blending!
Exposure Blending – what’s necessary
There is usually no other way than taking multiple images with different exposure – I normally take three:
- First exposure where you can see nice detail in the shadows (and the highlights will be probably completely blown). You’ll achieve that e.g. by longer shutter speed. Histogram to the right (bright image)
- Second exposure where you’ll be able to see details in the bright areas, which might lead to having the darker areas completely black. You’ll achieve that e.g. by shorter shutter speed. Histogram to the left (dark image).
- Third exposure will be somewhere in between, you’ll expose for the mid-tones.
Then you’ll need to combine these exposures in Photoshop. Essentially, you’ll take the best from each exposure and combine into one image. Like in case of my final image:
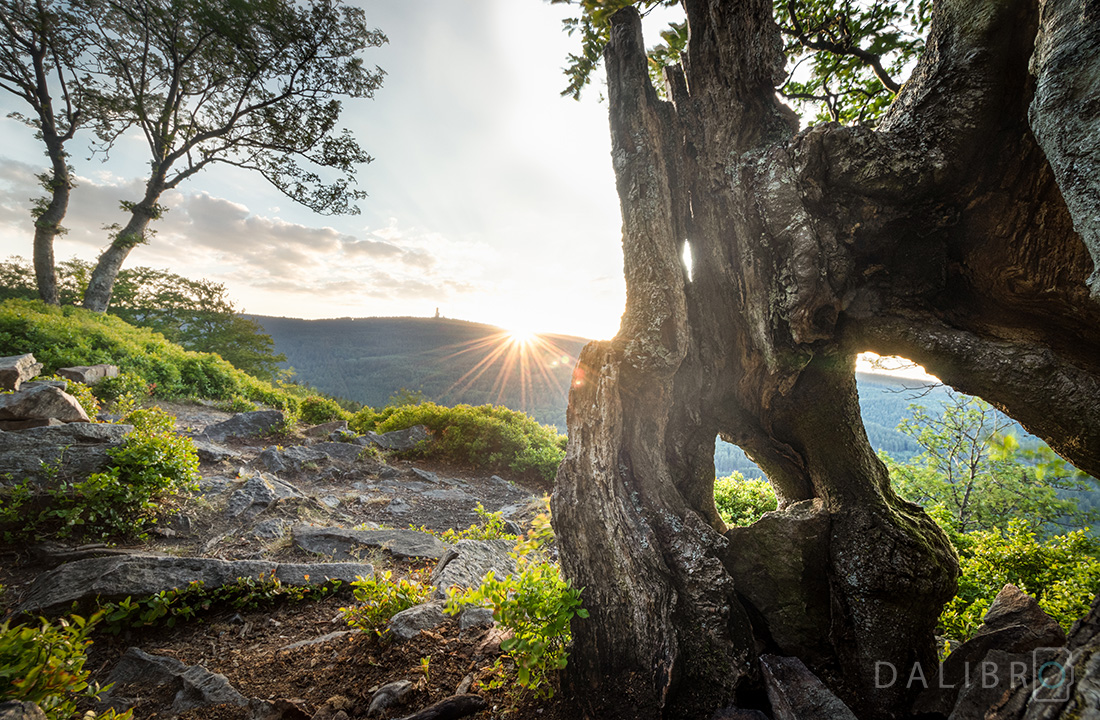
This wouldn’t be possible without exposure blending. Some purist photographers consider this cheating but I don’t think so.
It’s just a way around the technical possibilities that current cameras have. I personally prefer single-exposure images. Simply because I’m really lazy when it comes to image processing.
However, before you shoot multiple exposures like crazy, don’t forget it is a lot of extra work in editing! 🙂
And how do you use histograms? Let me know!



Really good explanation and easy to understand I will take your knowledge into my learning photography thank you
Thank you Keith! I’m glad you found it helpful! 🙂
ilwa9i